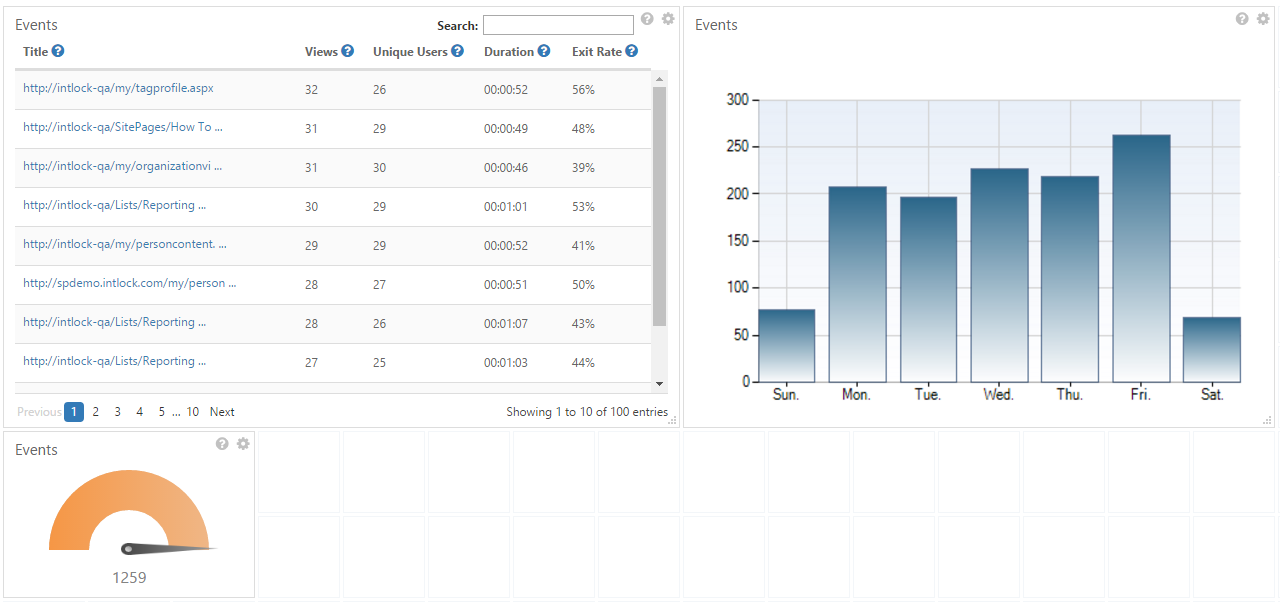
This report shows the number of events, filtered by event name or URL address. An event is a view or click on any specified webpage or website item. This report is designed for tracking custom events such as mouse clicks on specific UI elements. It is typically used for campaign tracking, however it can also be used to filter reports by a specific URL address or all page URLs beginning with a specific URL address.
Events Report
Notes:
- By default each SharePoint page view is automatically logged and reported by CardioLog Analytics as a 'view event' with the URL as the event title.
- Event filtering supports the use of wildcards. For page view events, wildcards can help filter specific document extensions or URL query string parameters. For example, if you would like to display page views for PDF documents only, enter %.pdf in the Website Item URL filter in the widget preferences. The percent sign (%) wildcard character is a substitute for all possible character strings.
- Learn how to fire custom events with the CardioLog Analytics client API
- Learn how to use goal funnels to report on campaign events.
Available Report Widgets
Meter, Chart, Table, Map
Table Widget
The Events table widget contains the following columns:
- Title - The event name, or the URL for page view events.
- Views - The number of times the event has been logged.
- Unique Users - The number of individual visitors who triggered the event, identified by login information, an anonymous cookie, or IP address.
- Duration - In cases where the event represents a page view, duration is the average time spent by visitors on the page
- Exit Rate - In cases where the event represents a page view, exit rate is the percentage of times a specific page was the last page viewed in a visit session to your web site.
Map Widget
This report provides a world map representing all events by country. Countries are color coded, with darker colors representing higher values. The key in the bottom right corner of the widget displays the highest value for any country shown. Mouse over a country to display the number of page views. CardioLog Analytics uses internal and third-party data to derive visitors' geographic locations from their IP addresses. Use the tools on the left side of the widget to zoom in and out of the map, and to navigate around the map.


