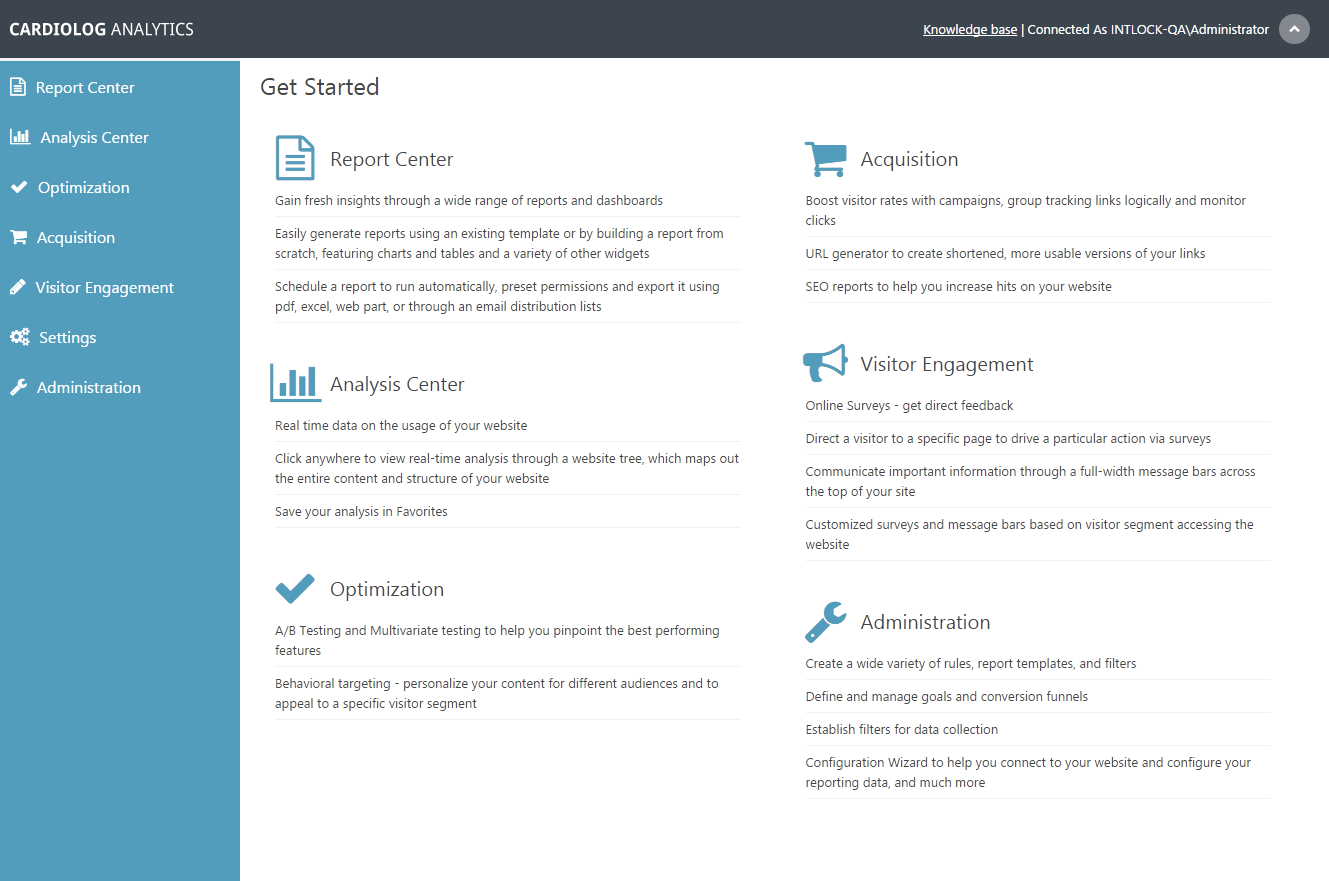
The main screen includes the following sections:
- Report Center - Create scheduled reports using diverse web analytics metrics. These reports can be exported and shared with colleagues and associates.
- Analysis Center - Create detailed real-time and ad-hoc web analytics reports.
- Optimization - Create A/B and multi-variate tests to improve performance across different user groups.
- Acquisition - Improve the content and structure of your website by identifying SEO violations like broken links and performance issues.
- Visitor Engagement - Create, design and implement surveys and message bars throughout your website, and create real-time website personalization rules to display content designed to appeal to specific visitor segments.
- Settings - Create report templates, goals and visitor segments.
- Administration - Manage diagnostics and configuration.
CardioLog Analytics User Interface
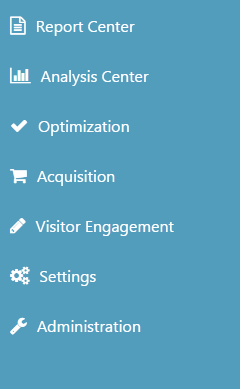
- Use either the left Navigation pane or the central area of the Main Window to access different parts of the application.
CadioLog Analytics Navigation Pane
- The Central Area initially displays a summary of each section.
- Once an item is selected from the navigation pane, the Main Window displays a summary of that section's options.
CardioLog Analytics Main Window


