Page History
Contents
- How to Create a Report
- How to Copy a Report
- How to Create a Report based on a Template
- How to Set Permissions for a Report
- How to Export a Report to Excel
- How to Export a Report to PDF
- How to Export a Report as a Microsoft SharePoint Web Part
- How to Send a Report via Email
- How to Set an Email Distribution List for a Scheduled Report
- How to View a Report from SharePoint's "Site Actions" Menu
Use the Report Center to gain a fresh insight into your website with a wide range of usage reports and dashboards. In the Report Center, you can easily create dynamic reports that feature charts and tables, either by making use of one of CardioLog's existing templates, or by building a report from scratch. You can schedule a report reports to run automatically at any interval you like, and you can preset set permissions to for who can view and /or edit a certain each report or dashboard to ensure that the right people have access to the right data. It's also possible to export a report to various in several standard formats including SharePoint web parts and CSV, and to email a report to a new address or a predetermined distribution list.
reports to distribution lists or individual colleagues.
Contents
| Table of Contents | ||
|---|---|---|
|
Anchor create
| create |
...
new create
| new | |
| create |
...
new
How to Create a Report
| new |
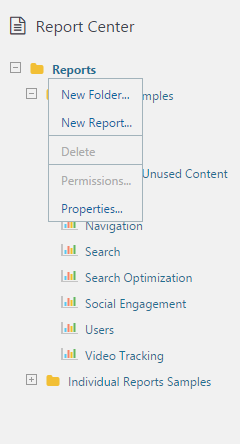
- In the Navigation pane, under Report Center, click a folder in the Reports tree, and then select New Report. (You can first create a Reports folder by selecting New Folder...)
Create a new report
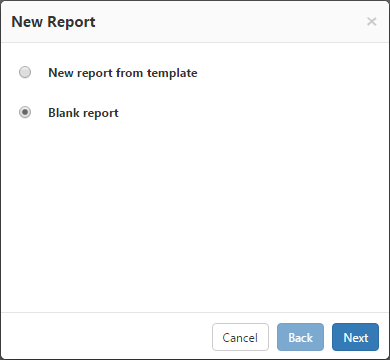
- While in the New Report dialog, select the Blank Report option and click Next:
Create a blank report
Blank Report
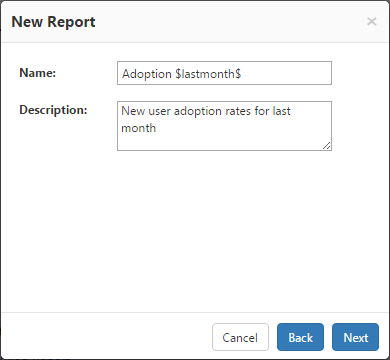
Enter the Name and Description fields, and then click Next.Anchor create-new step 3 create-new step 3
To display dates in the Name and Description fields field of generated reports, use may the following variables: $now$, $today$, $lastday$, $thisweek$, $lastweek$, $thismonth$, $lastmonth$, $thisquarter$, $lastquarter$, $thisyear$, $lastyear$
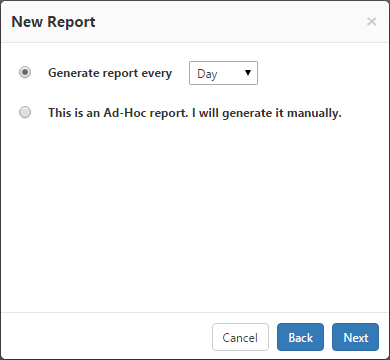
New Report detailsProperty Details- Choose to either schedule the report by day, week or month from the drop-down menu, or you can generate your report manually by choosing selecting This is an Ad-hocHoc report. Then click OKNext.
Report scheduling
The ad-hoc report generation option - Your new report now appears in the Navigation Pane and you can click it and select Edit.
Opening a report
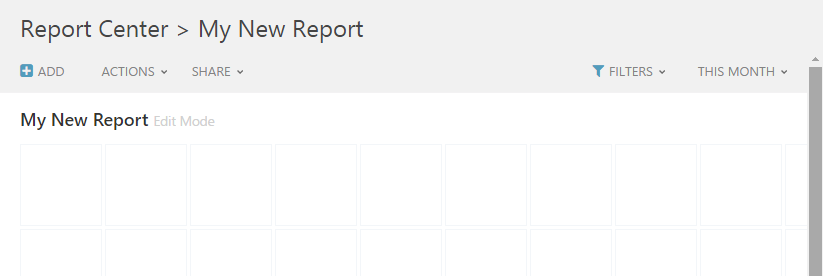
The blank report opens Your should now be viewing your newly created report in edit mode. The report also appears in the Navigation Pane and can be viewed and edited freely by anyone with sufficient permissions. - As you move your mouse cursor around the main window, you'll notice that each square of the report grid displays a plus sign (+), Click any square to add a new widget to in the main window of the report. Alternatively, you may click ADD in the top toolbar. Continue on to report editing for more information.
| Anchor | ||||
|---|---|---|---|---|
|
Reports may be edited at any time without affecting previously collected data.
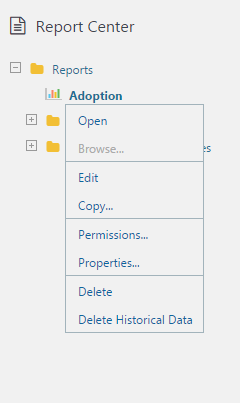
- Find the report you would like to edit in the Navigation Pane, click it, and then select Edit from the contextual menu.
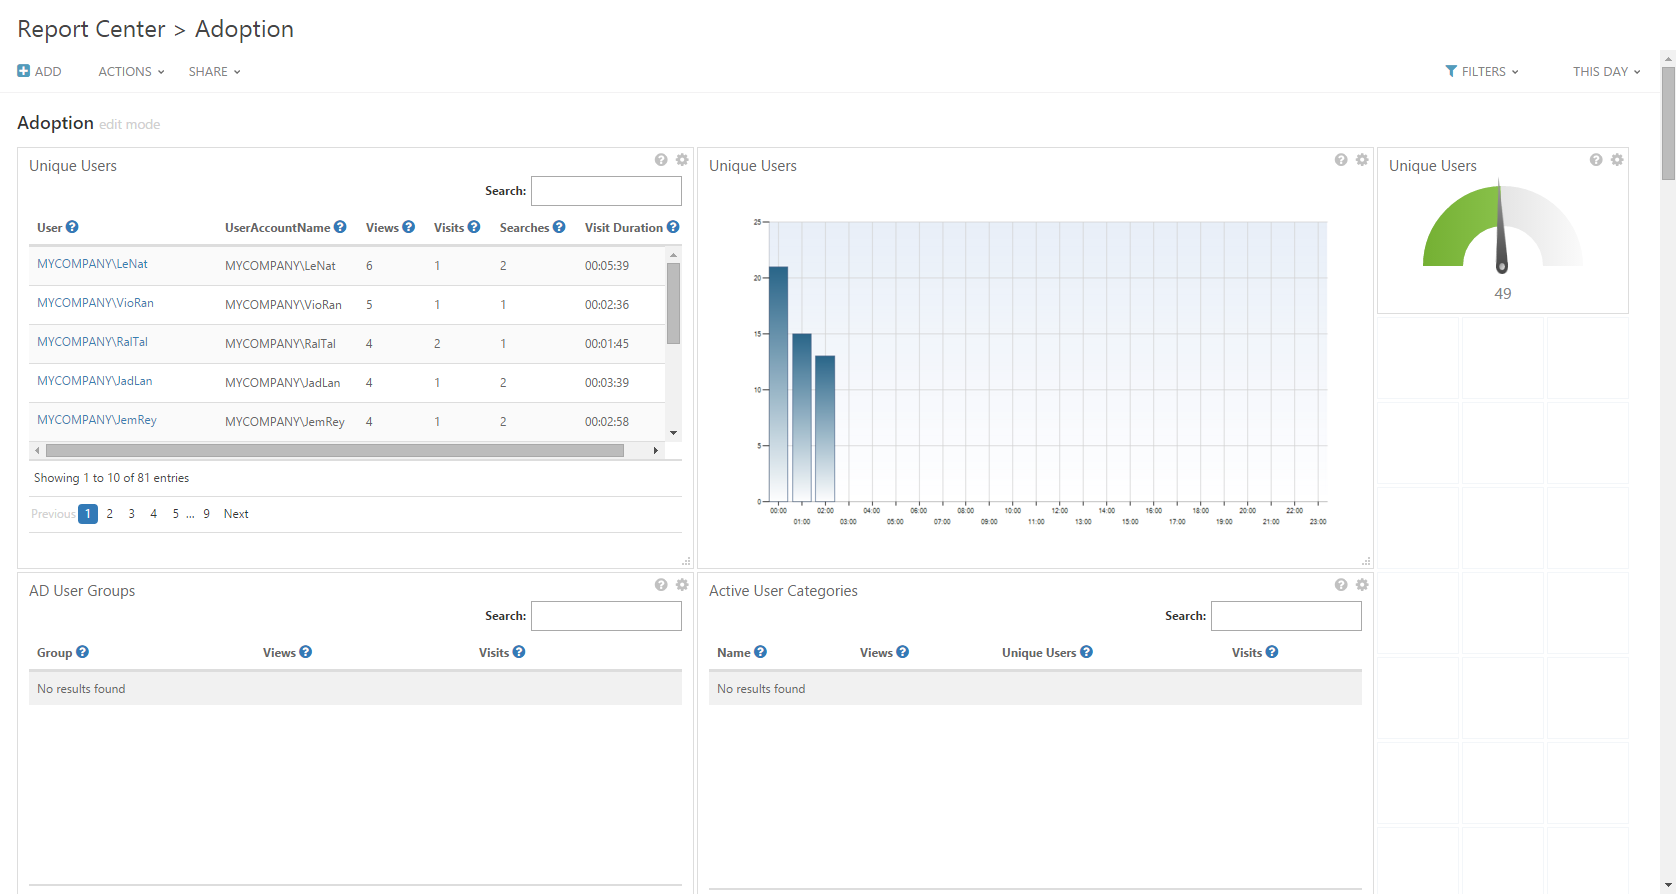
Report Contextual Menu - The report will now open in Edit Mode. When a report is in Edit Mode, you can add widgets Widgets to it.Click , change the time range, edit filters and export a CSV file for use with Excel and other spreadsheet applications.
- You can click any blank area of the report where a plus sign appears as you hover your cursor, or click Add at the top of the Central Area Toolbar and select a widget to add to the report (for a complete list of available widgets, see the Reports Gallery).
Add widgets to a report
. Continue on to widget editing for more information. The Reports Gallery contains a full description of all widgets.
Blank Report Edit Toolbar
The following actions are available in the Top Toolbar while in Edit Mode or Static Mode:Anchor top toolbar top toolbar - Add - add widgets to the report.
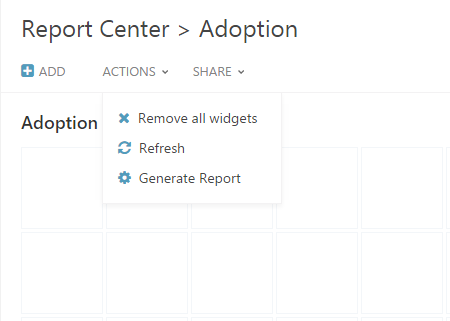
- Actions Menu
- Remove All Widgets - Clears all widgets from the current report.
- Refresh - refresh the report's settings.
- Generate Report - create the report in real time.
Actions menu - Remove All Widgets - Clears all widgets from the current report.
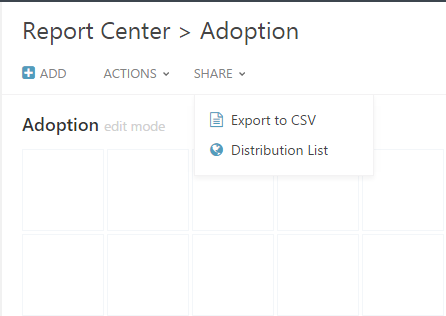
- Share Menu
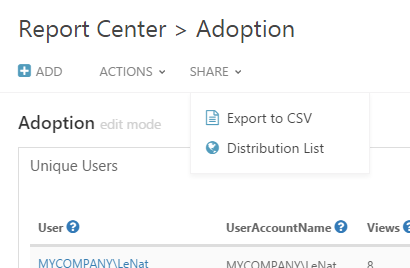
- Export to CSV - export Export the data to Microsoft Excel (see How to Export a Report to Excel)Excel or other spreadsheet applications.
- Distribution List - send Send the report to a distribution list (see How to Set an Email Distribution List for a Scheduled Report).
Share menu
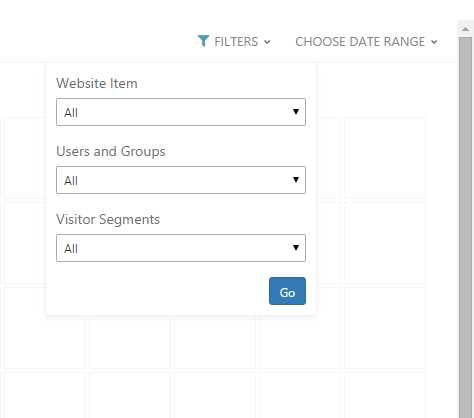
The Filters menu allows you to limit the data displayed to specific pages, users or groups, or visitor segments for all widgets simultaneously. Alternatively, you may edit each widget's filter preferences individually to suit your needs.
Filters menu - Export to CSV - export Export the data to Microsoft Excel (see How to Export a Report to Excel)Excel or other spreadsheet applications.
- After designing the report, it is possible to you can create a static version with real time data (by selecting Generate Report), or to wait until the report is automatically generated according to the report schedulingat the next scheduled interval. As long as there are no static versions for the report, it will be displayed in Edit Mode (if there are edit permissions for the current user) if it is when selected from the Reports tree in the Navigation Pane, assuming the current user has sufficient permissions. Otherwise, the latest static version will be displayed.
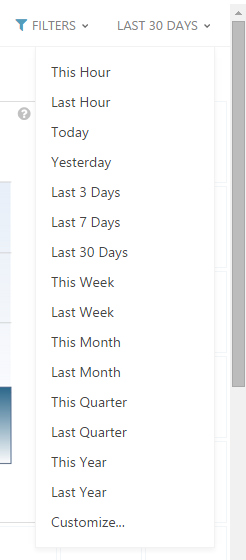
A Static Report with several active widgetsActive Widgets - Edit the time frame for a static report by clicking the Date Range link the current Time Range menu on the top right of the report. Select the desired date range and time interval and click OK.
, or customize to highlight a specific period of time.
Choose Date Range menu
Menu
Customized Date Range - To remove the report, including all previous versions right click the report title in the Navigation Pane and select Delete. To remove only the previous versions of the report and associated data, select Delete Historical Data. The report's Historical Data refers to all prior report versions that are have been saved in the system. If a version exists for a selected date range, the original saved version is displayed, and no query is submitted to the database. This is in order to save system resources and speed up streamline report generation.
- To modify the report properties including report title, description, and scheduling type), click the report and select Properties on the Navigation Pane. To view the report in a new window (without the CardioLog scheme) on the Navigation pane, click the report and select Browse.
Report file menu
...
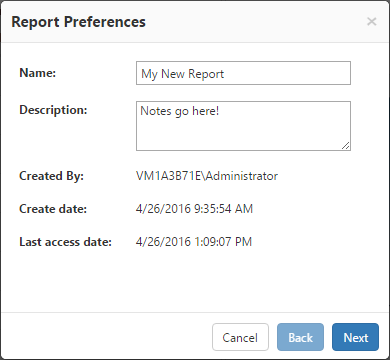
- Select Properties in report's contextual menu in the Navigation Pane to modify the report information. There are six property fields and the first three listed here may be edited at any time:
- Name: The name of the report as it appears in the Navigation Pane and all further saved versions.
- Description: An optional description of what the report contains, or notes.
- Scheduling: You may change between scheduled or Ad-Hoc report generation at any time. If a new report schedule is chosen, the report will be refreshed at the next relevant scheduled interval, not immediately.
- Created By: The username of the person who originally created the report
- Create Date: The date and time the report was originally created
- Last Access Date: The most recent time and date that the report was opened or viewed in CardioLog.
Report Properties
- Select Permissions to edit who may view, edit or modify the report as described below.
- Select Browse in the report's contextual menu in the Navigation Pane to view the report isolated in a new window, without the CardioLog scheme. Browse is only available after at least one report has been generated.
| Anchor | ||||
|---|---|---|---|---|
|
Once a report exists in your CardioLog Report Center, you may continue to edit it whenever you see fit without affecting data collection or previous report data. The latest version of CardioLog allows you to easily drag and drop widgets within a report. expand and shrink charts, tables and maps, and simply click to add new widgets exactly where you would like them in a report. Visualizing your data is dynamic and intuitive.
- To add a new widget, click any blank area of the report where a plus sign appears as you hover your cursor over the central area, or click Add at the top of the Central Area Toolbar and select a widget category.
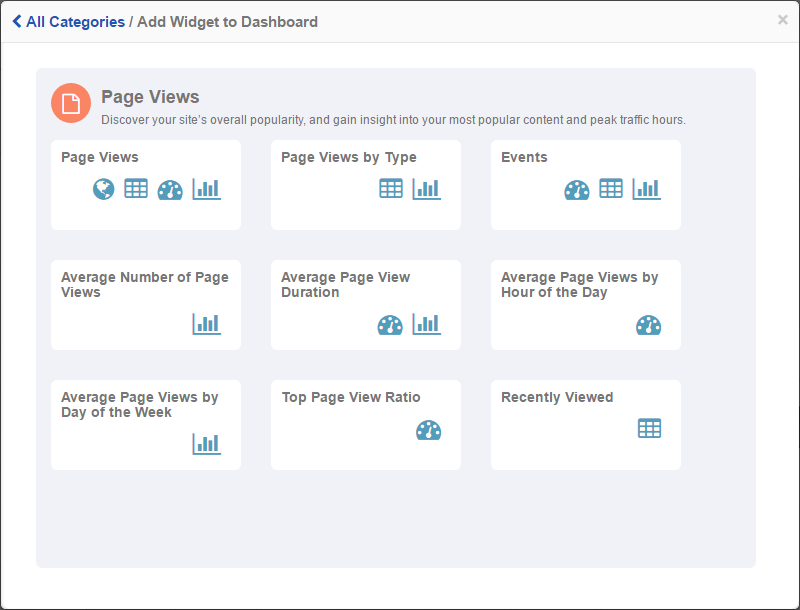
Add Widget Dialogue - Click the category type you'd like and you'll be presented with a list of all available widgets in the category. Click on the icon of the available widget type you'd like: map, chart, meter or table. The new widget will now appear in your report. To add more widgets, repeat these two steps.
Page Views Widget Category - Once a widget is available in your report, you can edit all filters and time ranges for each widget separetely from the whole report as long as the report is in Edit mode.
- Click on the title of a widget to move the whole widget to any part of the report's display, and to rearrange the presentation of the report.
- You can click on the right-side or bottom border of any chart, table or map widget to resize it to a comfortable view. This is especially helpful for charts and tables depending on the type and amount of information presented.
- In addition to full report export options described further below, you can also export individual widget data to a CSV file. Simply click on the setting gear in the upper right corner of any widget and select Export to CSV. A CSV will be downloaded to your browser's default download location.
| Anchor | ||||
|---|---|---|---|---|
|
The amount of resources needed for report processing depends on the number of scheduled reports, the number of database queries for each report and the timeframe selected for the reports (reports for 365 days require more resources then reports for 30 days). To ensure optimal operation, make sure you follow these recommendations:
- Number of Queries (Widgets) per Report - Limit the number of widgets in a report to a maximum of 6.
- Number of Results (Rows) per Query - Display only the top 100 rows in tables.
- Report Filters - Define a black list rule when possible and avoid using the exclude (!) condition in the report filters.
- Report Scheduling Type - Make sure that the report scheduling type (daily/weekly/monthly) is in correspondence to the report date range, for example:
When a report's date range is "Last Month", schedule it to run once a month.
When a report's date range is "Last 30 Days",schedule it to run once a day. - Report Type ("By URL" Widgets) - Avoid using the "By URL" widgets (for example - "Events" (Page Views by URL) unless needed. When creating a report for a web site, search the website in Object Explorer (Analysis Center), and use the appropriate tree item as the source of your report.
Use the "By URL" reports only for:- Web sites which do not exist in Object Explorer
- Retrieving URL Parameters in the report
- Tracking banner and button clicks
- Tracking custom events
- Number of Scheduled Reports - Delete unused scheduled reports. Use the CardioLog Analysis Center for real time queries or to create an Ad-Hoc report and generate it manually on demand.
Anchor copy copy
How to Copy a Report
| copy | |
| copy |
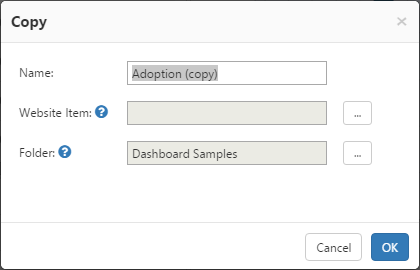
This useful feature allows you to copy an existing report and attach a Website Item from the Object Explorer.
- On the Navigation pane, under Report Center, click a report from the Reports tree and select Copy.
...
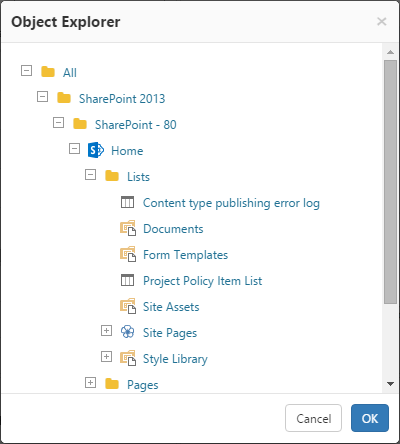
Copy report dialogue- In order to include a Website Item, select the ellipses on the right to open the Object Explorer
...
Object Explorer- To change the location where the report copy will be saved, click the ellipses to the right of the Folder text box.
- Click OK to save your copy.
- The copied report will now appear in the Navigation Pane, in the folder you have chosen.
Anchor create-template create-template
How to Create a Report
| create-template | |
| create-template |
...
Based On A Template
- In the Navigation Pane
...
- under Report Center, click a folder in the Reports tree and
...
- select New Report
...
- from the contextual menu.
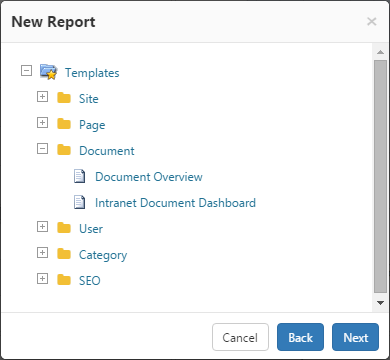
- In the New Report dialog, select
...
- the New Report From Template option and click Next.
- Select
...
- the
...
- Report Template you would like to use in the Report tree.
- Continue with the
...
- new report creation steps as described above
...
- in How to Create a New Report. For more information see "
...
...
New Report Template browser
Anchor permissions permissions
How to Set Permissions for a
| permissions | |
| permissions |
...
Report
Permissions are available in CardioLog installations which include integration with Active Directory.
You can set view, edit (Edit Mode), modify (properties and permissions) and remove (
...
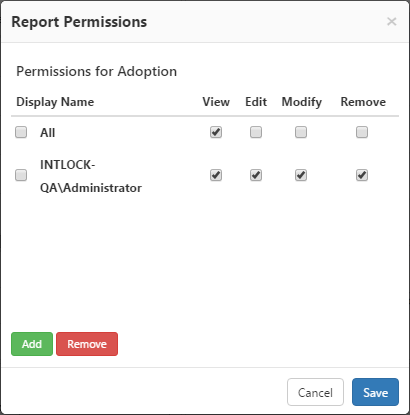
delete) for a specific report for any user or group in Active Directory. By default, the report creator has full control permissions, while view permissions are given to everyone. Additionally, Users and groups can be added, and deleted. Members who have been granted access can also modify existing permissions.
- In the Navigation pane, under Report Center, click a report from the Reports tree and select Permissions.
- In the Permissions dialog, select the desired permissions for the listed users by activating or deactivating the check boxes. User permissions precede group permissions. To assign permissions for all users, use the default "All" group
...
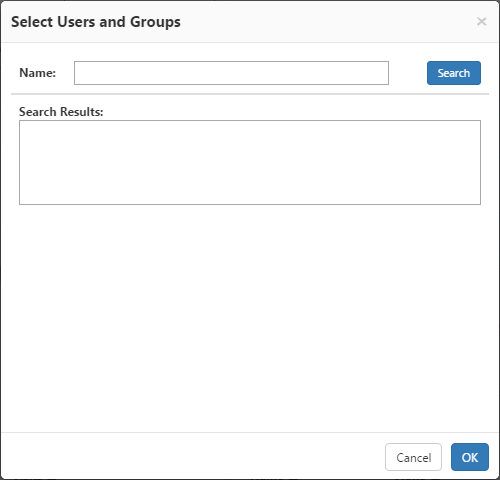
Permissions window- To add a user or group, select Add and search for the desired user or group.
...
- Click OK to confirm your choice
Users and Groups search window - To remove user(s) or group(s), select the check box on the left next to the user or group you would like to no longer access the report and then click Remove.
- Click Save to save the permissions.
Anchor export
| export |
...
excel export
| excel | |
| export |
...
excel
How to Export a Report to Excel and Other Spreadsheet Applications
| excel |
You can export a report to CSV file format, which can then be read by most spreadsheet applications. Unlike other file types, you may export a report that is actively being edited, or has not been generated yet.
- Click Export to CSV from the Share menu.
Share menu in Edit mode - The report will be downloaded to your default downloads location.
Anchor export
| export |
...
pdf export
| export |
...
pdf
How to Export a Report to PDF
You can export a report from the Report Center to PDF format
...
. The report must be in View Mode. Click Generate Report from the Actions menu if a Static Report does not exist yet.
- When the report is in View Mode,
...
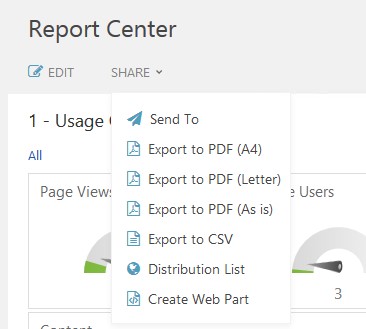
- you will have 3 options to Export to PDF from the Share menu.
...
Share menu in View mode
...
- Export to PDF (A4) - the report will be
...
- saved as a PDF file with page size A4.
- Export to PDF (Letter) - the report will be saved as a PDF file with page size Letter.
- Export to PDF (As is) - the report will be saved as a PDF file with a custom page size (report dashboard size).
- When selecting Export to PDF (A4) or Export to PDF (Letter), you will be able to select the page orientation - Portrait or Landscape.
- The report will be downloaded to your default downloads location.
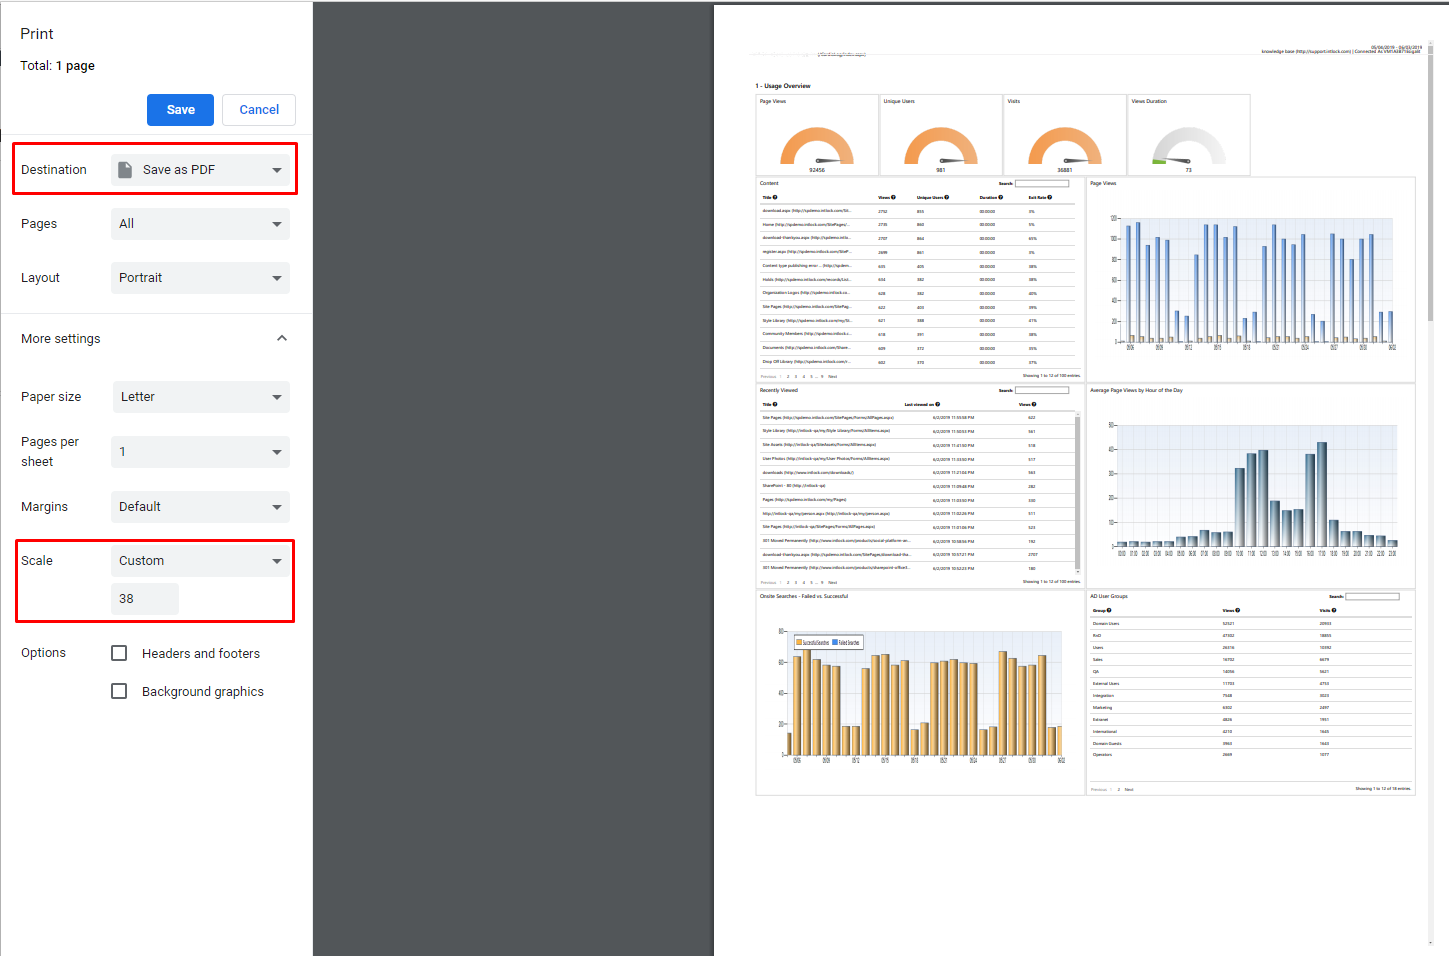
You can also control the report layout by printing the report and saving it as PDF:
- On the Navigation pane, under Report Center, click the report from the Reports tree and select Browse. If the Browse option is grayed out, select Open and click Generate Report from the Actions menu
...
- , to generate a static report.
...
- In the new report
...
- window, open the browser settings menu and select Print.
- In the Print Preview window, open the advanced settings and edit the scale options in order to shrink the report layout to fit the page.
- Choose Save as PDF in the printer destination.
Example - Print settings in Chrome
Anchor send email send email
How to Send a Report via Email
| send email | |
| send email |
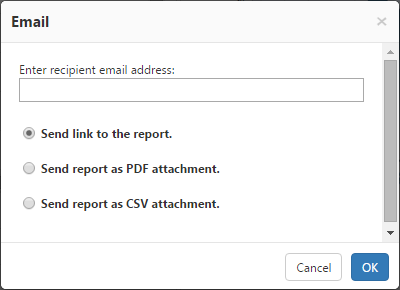
- When the report is in View Mode, click Send To from the Share menu.
- In the new email window, enter an email address
- Choose how you would like your recipient to view the report and click OK.
Send Email window
| Anchor | ||
|---|---|---|
...
|
...
|
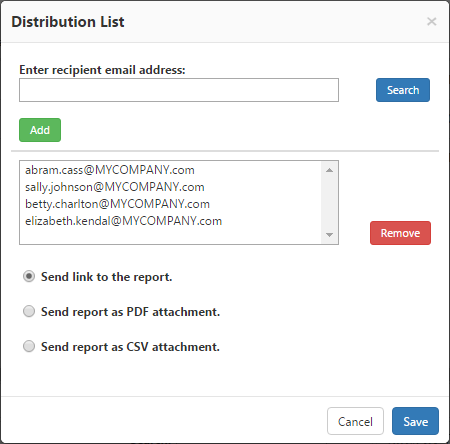
Once a new non ad-hoc report is created, an automated email can be sent to a predefined distribution list. This email includes a unique link, a PDF file or CSV file attachment with the most recent report data. The email may be sent to the distribution list monthly, weekly or daily, according to the report's scheduling preference.
- Open a report in View Mode and select Distribution List from the SHARE menu.
- Enter an email address in the text box and click the Add button to add the address to the distribution list.
- Add any additional email addresses you would like to include.
- Click Save.
Distribution List Dialogue
| Anchor | ||||
|---|---|---|---|---|
|
- Confirm the report is in View Mode.
- Click Generate Report from the Actions menu if at least one Static Report does not exist yet. Click Create Web Part from the Share menu.
In the Create Web Part window, choose if you would like to embed the web part in a SharePoint classic page or a SharePoint modern page.
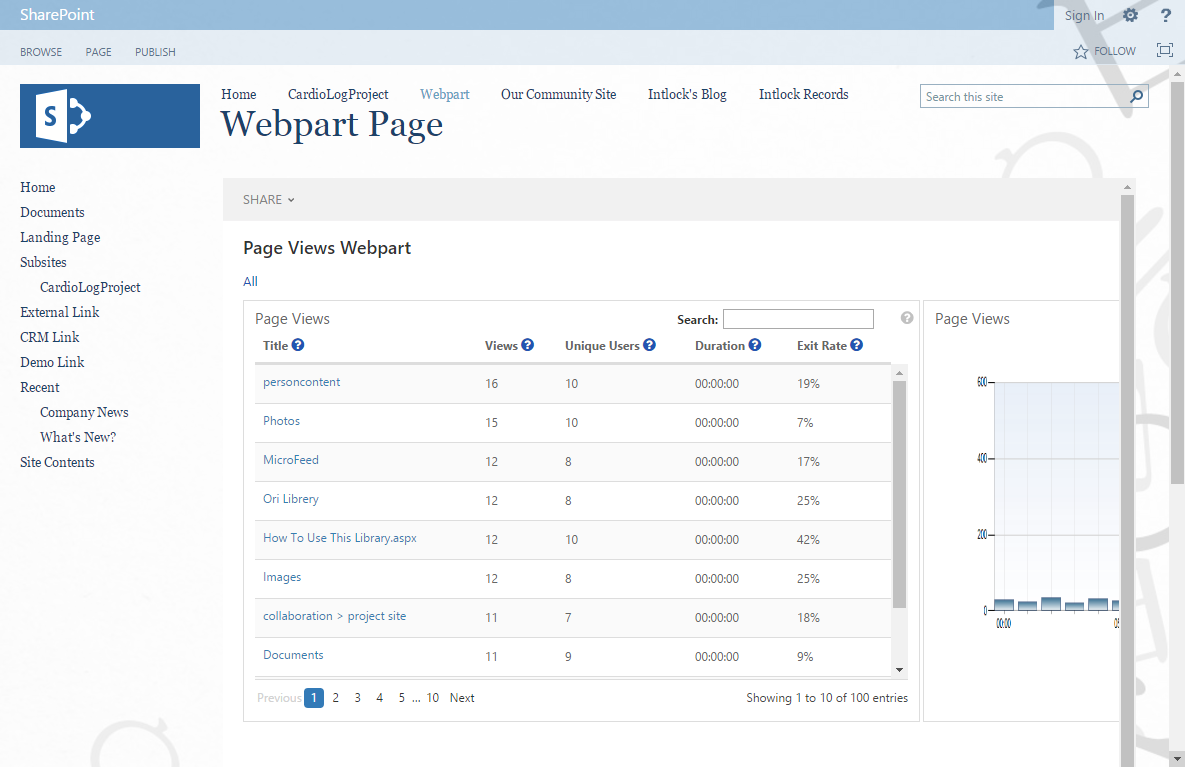
Create Web Part DialogueWhen selecting Create web part for SharePoint classic pages and clicking OK, the report will be downloaded as a DWP file to your browser's default downloads location. You can then add the dynamic Dashboard Web Part to your SharePoint classic web site.
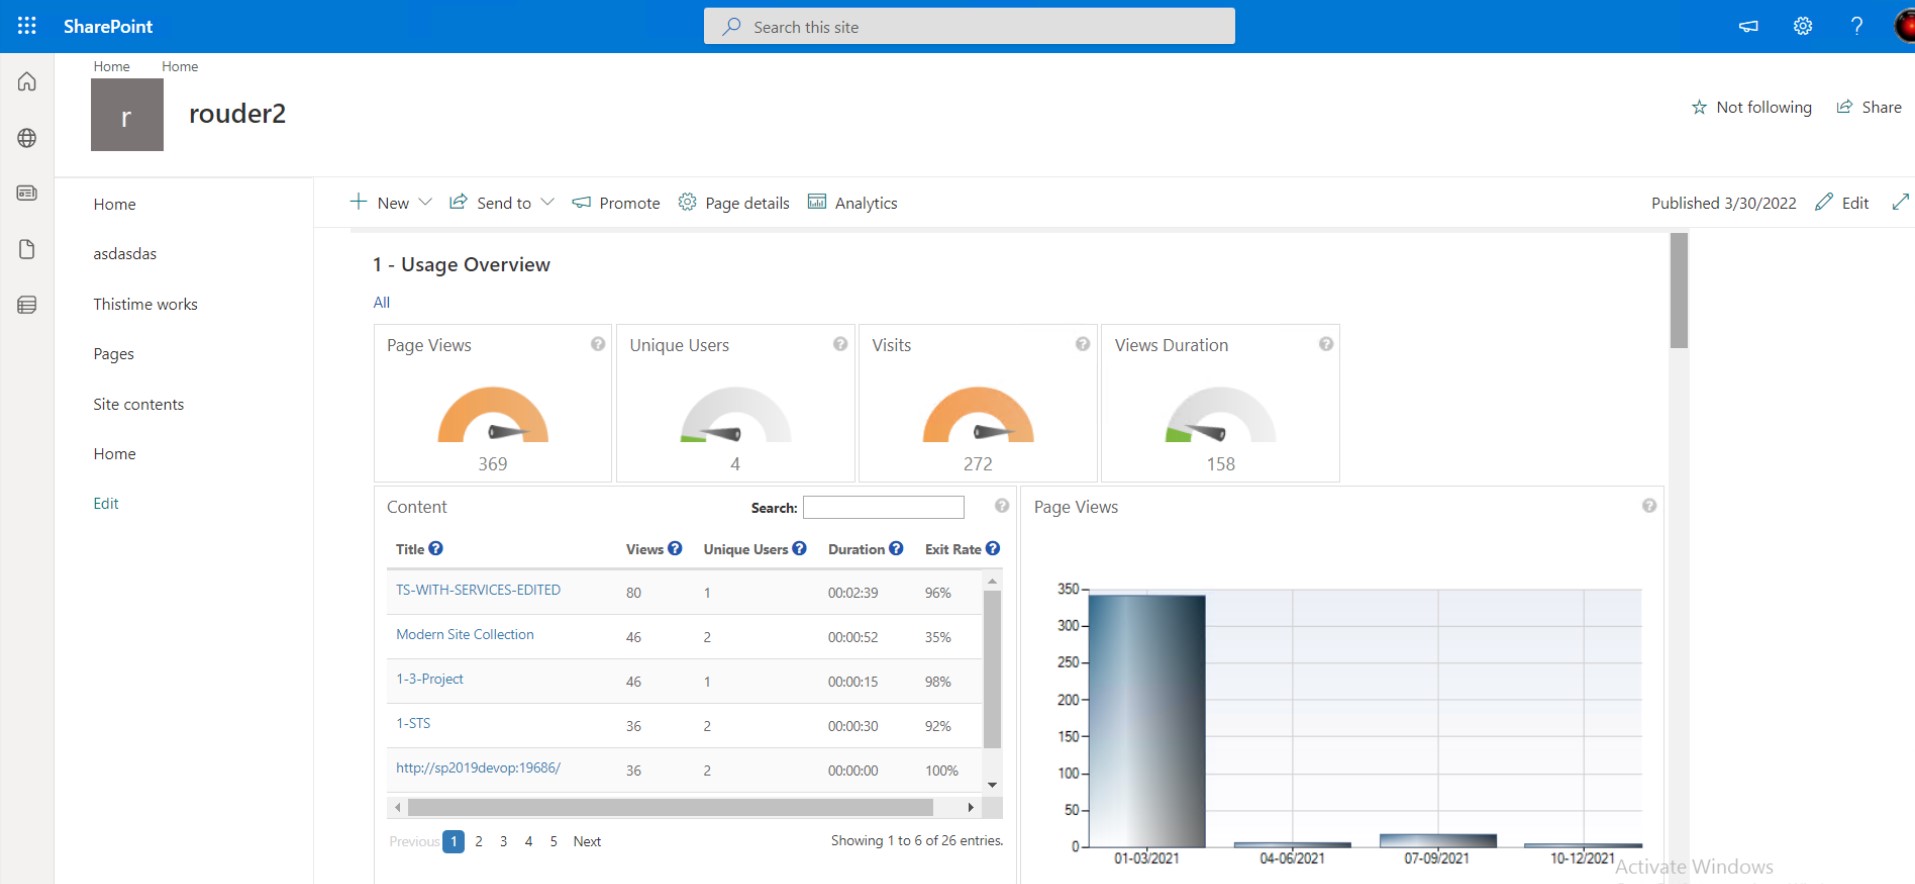
CardioLog report web part displayed on a classic SharePoint site
- When selecting Create web part for SharePoint modern pages and clicking OK, the web part code will be copied to clipboard. You can then embed the web part code in your SharePoint modern pages using the Embed option. Please note that only secure content can be embedded; therefore the CardioLog web application must be configured with SSL (see instructions under How can I configure secure access to the CardioLog website with HTTPS? in this guide for more details).
CardioLog report web part displayed on a modern SharePoint site
| Anchor | ||||
|---|---|---|---|---|
|
- The CardioLog system administrator must first create and publish report templates. These templates will then be available from all SharePoint portal pages.
- Once logged into the SharePoint portal, click the Site Actions settings gear to access the page options, By default, the logged in user requires SharePoint view permissions to see the report.
- Click Site Statistics to generate a usage report for your page. The report will open in a new browser tab or window depending on your local preferences.
- Select the desired report template and date range in order to run a relevant usage report for the page you are visiting.
CardioLog Site Statistics SharePoint Menu Item
