Page History
Widgets are the building blocks of any report that you may design in the Report Center. In order to add widgets to a report, you can create a new report or find the report you would like to edit, then click Add from the Top Toolbar, or click any "+" in a blank space of the report and select the desired widget from the menu.The latest version of CardioLog allows you to easily drag and drop widgets within a report. expand and shrink charts, tables and maps, and simply click to add new widgets exactly where you would like them in a report. Visualizing your data is dynamic and intuitive.
All widgets are displayed in one of the following forms:
- Meter - A gauge component that displays a single value. Meters display data in either Specific mode* and Aggregated mode**. For example, the Page Views Meter displays the number of page views for a site and all its sub sites.
- Chart - A graph component that displays data over time , in order to see trends. Charts display data in both Specific and Aggregated modes. For example, the Page Views Chart displays the number of page views for a site home page in the " Specific " series, and the number of page views for a site home page and all its sub-sites in the Aggregated series.
- Table - A text chart component that displays a list of data for each relevant category. Tables display data in " Aggregated " mode. Each table row displays data in Specific mode. For example, the Page Views Table displays a list of items on a site and all its sub sites. The number of page views for each item is specific to that item URL.
- Map - A map component which displays geolocation data.
...
** Displays the number of page views for a site and all its sub sites. 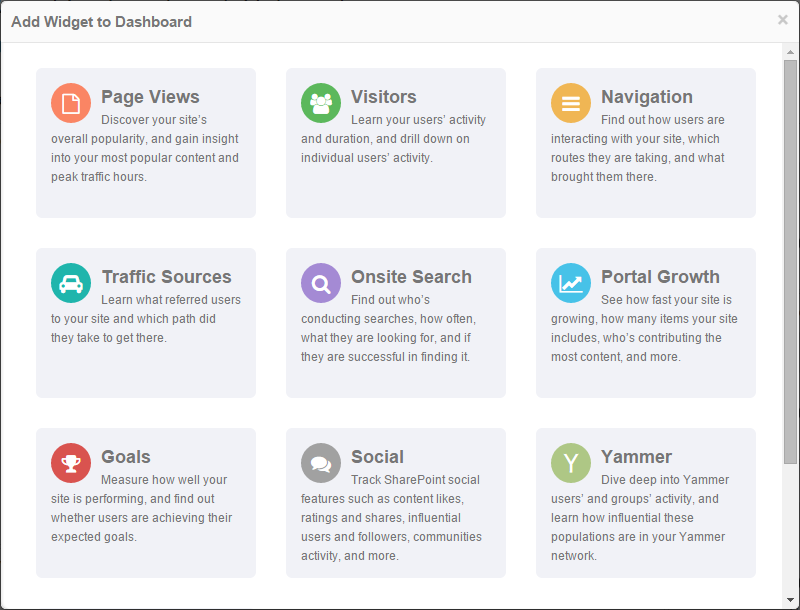
Contents
Add Widget Dialog
...
- How to Add and Modify Widgets
- Actions
- Preferences
- Actions
- Help
- Set Preferences Preference Filters for all Widgets in a Report
- Cached Mode
- Data Drilldown
...
| Anchor | ||||
|---|---|---|---|---|
|
In order to add widgets to a report, you can create a new report or edit an existing report.
- To add a new widget, click any blank grid area of the report where a plus sign appears as you hover your cursor over the central area, or click Add at the top of the Central Area Toolbar and you'll see the Add Widget Dialog. Select a widget category.
Add Widget Dialog - Click the category type you'd like and you'll be presented with a list of all available widgets in the category. Click on the icon of the available widget type you'd like: map, chart, meter or table. A full description of each widget and it's available types can be found in the Report Gallery.
Page Views Widget Category - The new widget should now appear in your report. To add more widgets, repeat the previous steps.
- Click on the title bar of a widget to move the whole widget to any part of the report's display, and to rearrange the presentation of the report. You can continue to visually edit your report at any time, which can be helpful for understanding different metrics in relation to each other.
- You can click on the right-side or bottom border of any chart, table or map widget to resize it to a comfortable view. This is especially helpful for charts and tables depending on the type and amount of information presented. Occasionally, a widget may not immediately adjust to fit the frame size. You can click Refresh or Generate Report from the Actions menu to resolve this issue.
| Anchor | ||||
|---|---|---|---|---|
|
The gear icon in the top right corner of all widgets is knows as the Actions, or Widget Settings button. It has the following options:
- Remove - Delete the widget from the report
- Edit - Open the Preferences dialog
- Export to CSV - Export the widget's currently displayed data for use with Microsoft Excel and other spreadsheet applications.
- Restore to Default Preferences - Reset the widget to the default setting for all preferences

Widget Settings Menu
| Anchor | ||||
|---|---|---|---|---|
|
Once a widget has been added to a report, widget preferences can be set as well. The Preferences dialog can be opened by slicking the Settings gear in the upper right hand corner of any widget and selecting Edit.
The Preferences dialog displays the widget settings, and is divided into sections using the tabs at the top of the dialog window. Depending on which type of widget it is, any of the following sections will be available:
- Appearance - Set the visual display appearance of the data.
- Filter - Set the filters to limit the collected data .
- Group By - Set the various groupings of the data and the data series (available for charts which support multiple series).
- Advanced - Set additional options.
- Meter Preferences - Set preferences for a specific meter widget
- About - Provides a basic summary of the widget

| Anchor | ||||
|---|---|---|---|---|
|

| Anchor | ||||
|---|---|---|---|---|
|
The date range includes fixed values between This Hour and Last Year, along with a Customize... option.
- The Customized Date Range dialog displays two date selection options: calendar date selection and last X number of days. When your cursor is in either the From or To text boxes, you may also simply click the desired date on the calendar to choose a new date
- The Time Interval drop down list defines the intervals for displaying the data.
- The Last Days detail allows you to enter the amount of days preceding report generation.

Customized Date Range Dialog
Chart Widgets display each available time range with a default time interval setting, and will automatically display labels along the x-axis for convenience. You can change labeling behavior using a chart widget's Appearance preferences, and alter the time interval setting either using the customized date range option as shown above, or within the Group By preferences.
The default time interval setting for each time range is:
- This/Last Hour - Minute
- Today/Yesterday - Hour
- This/Last Day - Hour
- Last 3/7/30 Days - Day
- This/Last Week - Day
- This/Last Month - Week
- This/Last Quarter - Month
- This/Last Year - Quarter
- Custom Date Range - Day
| Anchor | ||||
|---|---|---|---|---|
|
You can include All website items for a specific widget, or choose Customize... and manually select and add individual items. You may also remove items using the same dialog.

Object Explorer Dialog
You may also enter a term to Search for it within the Object Explorer, which will open a new dialog window. Click Browse to return to the selected item in the Object Explorer.

Search Results Dialog
| Anchor | ||||
|---|---|---|---|---|
|
Enter a login account name or display name in the Name field and then click Search. Select the desired result and click the Add button to add it to the filter. To exclude a user or group, click the Exclude button (the name will appear in red).
Filters are given precedence to users over groups. For instance, if a selected User A belongs to an excluded Group B, then User A will be contained in the results data.

Select Users and Groups Dialog
| Anchor | ||||
|---|---|---|---|---|
|
From the Filter tab, you may include choose to include No Visitor Segments or choose Customize... to open the Select Visitor Segments dialog, which includes the following options:
- Pre-defined Segments - Filter reports using fixed segments based on traffic sources, including available short links and campaigns. For more information see "Visitor Segments".
- Traffic Sources - Filter reports according to sources referring to your internet website. Any of these details may be applied by Matches exactly, Does not match exactly, Contains, and Does not contain.
- Source - The domain where the traffic originates from
- Medium - Choose which medium such as email or web referred the user.
- Term - Term applies to traffic led to your site by a search term
- Campaign - The name of an active or former campaign.
- Content - Choose the content source that referred your visitors
- Source - The domain where the traffic originates from
- User Behavior: Goal - Filter reports by Goals. For more information see "How to Create Goals."
- Country - Filter reports according to which country on Earth your visitors are from. CardioLog uses internal and third-party data to retrieve visitors' geographic locations from their IP addresses.
- Active User Categories - Filter reports by Department and Region according to their classification in the Active Directory "Configuring Visitor Segmentation for Authenticated Users".

Select Visitor Segments Dialog
| Anchor | ||||
|---|---|---|---|---|
|
You can change and preview the visual appearance of the data displayed in charts from the Appearance tab in the widget preferences dialog. None of these settings will change how the data is collected. Some options have sub menus accessible by clicking them. These options appear with highlighted text and are Legend, Title, Axis X Title, Axis Y Title, Enable Scale Breaks, Chart Background, Chart Plotting Area, and Chart Series.
- Click Preview to view a live sample of your chart.
- Click Save to save all changes and return to your report.
- Click Cancel to return to your report without saving any changes.
Below is a short description of available appearance options. The X Axis is on the horizontal plane and usually displays a time based value. The Y Axis is on the vertical plane and usually displays the relevant data. Not all details are available for use at the same time.
Enable 3D | Display chart in 3D |
Enable 3D
Display chart in an angular view
Perspective
Display chart with values
Values
Display chart with legend
Legend
Display the legend inside the chart
Inside chart area
Legend style: List, Row, Column
Style
. This is required in order to view data over parallel time periods, which can be configured in the Group By details | ||
Perspective | Display chart at a slight angle; only available if 3D is enabled | |
Values | Display chart with numerical values above every data point | |
Legend | Display a legend describing each type of data point shown on the chart | |
| Inside Chart Area | Display the legend within the graph lines |
| Style | Choose from List (automatic), Row (horizontal), or Column (vertical) |
| Docking | Choose from Bottom, Top, Right, or Left to pin the legend |
Docking
Display chart with dates in legend
Show Dates in Legend
| Font Details | Assign text styles based on font typeface, font size, font color, bold, italic, and underline |
Font Style
Show Dates in Legend | Include the dates the widget is collecting data from in the legend | |
Title | Display the title inside the chart. The title is entered in the text box at the top of the dialog |
| Title style | Choose details for: |
| Alignment, font |
| typeface, font size, font color, bold, italic, underline |
X Axis Title |
Display the X axis title |
| X Axis Title Details | Title, alignment, font |
| typeface, font size, font color, bold, italic, underline |
Y Axis Title |
Display the Y axis title |
| Y Axis Title Details | Title, alignment, font |
| typeface, font size, font color, bold, italic, underline |
Enable Scale Breaks |
Insert a |
divider across the |
graph area of a chart to denote a break in continuity between |
high and low values on |
an axis. Use a scale break to display two distinct ranges in the same chart area. | |
| Scale Break |
| Details | Break line type, spacing, color |
Enable Scale Breaks
Show Preferences | Display the widget preferences in the report |
Show Help | Display a general description of the widget |
Show Help
Show X axis margins | Display chart with |
Show X axis margins
the first value on the x axis indented from | ||
Show all X axis labels | Display chart with all X axis labels |
Show All X axis Labels
, instead of rounded interval values | ||
Show all Y axis labels | Display chart with all Y axis labels |
Show All Y axis Labels
, instead of rounded interval values | ||
Highlight min and max vals | Highlight the data points |
on the graph containing maximum and minimum Y values |
Highlight min and max values
Highlight weekends | Highlight the weekends in a chart plotting area |
Highlight weekends
, (Weekends will only be highlighted if they are included within the date range chosen in the Filter tab) | ||
Chart Background | You may choose a background design to help present the data.
| |
| Chart background details | Background color, gradient, hatch style, secondary background color, border style |
Chart Background
. (Note: not all details are available for use at the same time.) | ||
Chart Plotting Area | You may choose a design for the graph area to help present the data | |
| Chart Plotting Area Details | Color, gradient, hatch style, secondary color, border style, border color, border size |
Chart Plotting Area
| (Note: not all details are available for use at the same time.) | ||
Chart Series | You may choose a design for the data points plotted on the chart | |
| Chart Series Details: | Gradient, hatch style, secondary color |
Chart Series
Chart type selection
Chart Type
Chart color scheme
Palette
Column, Bar chart: Default, Emboss, Wedge, LightToDark
Pie
Doughnut chart: Default, SoftEdge, Concave
Drawing Style
Column chart data points width
Point Width
Cylinder chart: data points thickness
Point Depth
| (Note: not all details are available for use at the same time.) | ||
Chart Type | Choose the type and style of graph you would like to display. Depending on the type of chart you choose, different relevant options will become available to choose from. | |
Drawing Style | If available for your desired chart type, select a display style for your data | |
Point Width | If available for your desired chart type, select the width of the bar or column. | |
Point Depth | Cylinder, Bar Cylinder | Select the display thickness of the data points |
Gap Depth | Cylinder, Bar Cylinder | Select the distance between data series that are displayed along different rows |
Clustered | Column, Bar, Cylinder |
| , Bar Cylinder | Display the data series along distinct rows |
Lighting | Area, |
Lighting
| Spline Area | Choose the lighting style for the design under the data curve
| |
Label Style | Pie, Doughnut | Choose where the data labels will be displayed: Inside, Outside, Disabled |
Radius | Doughnut |
Choose the amount of space in the center |
of the graph | |
Collect pie slices | Pie, Doughnut |
Collect small slices into a single slice to prevent overlapped labels |
Collect pie slices
| Collected % | Collect any slice that is less |
below the Collected % threshold into a single slice |
| Collected |
| color | Collected slice color |
| Collected |
Collected label
Separate the collected pie slice
Show exploded
| label | Enter a label for the collected slice that will appear inside the slice
| |
| Show exploded | Separate the collected slice slightly from the rest of the graph |

| Anchor | ||||
|---|---|---|---|---|
|
Data may be grouped using several parameters.
- Time Interval -
- The time (X) axis can be displayed in
- fixed resolutions between minutes and a year depending on your Filter Date Range settings.
- Chart Data - You may choose to label and sort the plotted data on your chart.
- Edit the label text you would like for each set of data reported
- Select the order of appearance using the drop down menu numbers between 1 and 4
- Enable the data you would like to appear on the chart using the check boxes
- All Pages - Displays data for a selected Website Item and all of its child items.
- Home Page - Displays data only for the selected website item.

Chart Widget "Group By" Preferences Dialog
| Anchor | ||||
|---|---|---|---|---|
|
Chart widgets can display multiple data series in parallel based on custom time frames, as shown above. You may edit their display title and compare parallel date ranges.
You can display data in widgets of type meter in different modes in the Advanced section.
- Home Page ("Specific" mode) - in order to display data for the selected Website Item home page select All Pages > No.
- All Pages ("Aggregated" mode) - in order to display data for all children items of a selected Website Item select All Pages > Yes.
In order to configure the report recipients see "How to create a distribution list for a report".
The Report Actions button does the following:
The Widget's Report Actions menu
- Edit - open the Preferences dialog
- Delete - remove the widget from the report
- Export to CSV - export the widget's data to Microsoft Excel
- Set as Default Preferences - save the widget's preferences as default preferences
- Refresh - refresh the data
- Restore to Default Preferences - restoring the widget's preferences to the default setting
Drag and Drop the widgets to change their placement in the report.
The help section displays the widget's preferences and includes a brief description regarding the widget's features. To open the Help section, click the help icon at the top right hand side of the widget.
The Widget's Help sectionThe "About this chart section" in the Preferences dialog- Enable the check box next to the page(s) you would like to compare to a previous period, as shown above.
- Click the time period next to the page(s) you would like compare, and then choose a date range using the Choose Parallel Period dialog, In the image above, you would click "1 Month ago"
- Choose a relevant time frame to compare. For example, you might choose 1 Month ago to compare data after a recent campaign. Or you might select 12 Months ago to compare the data to the same month of the previous year to account for seasonal discrepancies.
- Click OK to save your choice.

Choose Parallel Period Dialog
| Anchor | ||||
|---|---|---|---|---|
|
Compared to the chart widgets, most details are fixed for Tables. However, you can edit relevant parameters in the Advanced section, including:
- Number of rows - Choose the total number of rows to display. The widget will automatically sort pages if there are more than 10 items in the table.
- Minimum value - Set the threshold for reporting results. Items with values below this number will not appear. For example, by setting this value to 0 in the Page Views report, pages that were not viewed at all will be included in the results.
- Sort order - Choose between ascending or descending for the default display. Clicking on a column title will sort the table according to that column, clicking the title again will sort the column in the opposite order.
- Show Aggregated values for child items - Choose to display values that include all sub-items on each row, or exclusively the listed item.
- Show first level child items only - Choose to show results for only the first level of sub-pages below the selected item as organized in the Object Explorer.
- Compare to Past Period - Enable this to display two more columns that report the relevant value of each row for the past period and it's percent change. For example, if the Filter Date Range is "This Week" for a Page Views widget, the Past column will show the page views for "Last Week"

Table Widget Advanced Preferences
| Anchor | ||||
|---|---|---|---|---|
|
The latest version of CardioLog now allows you to search the text of any table. In the upper right hand of any table widget is a search bar.
- Simply enter a search phrase and results will actively filter within the table.
- Delete the text to have the full table data presented again.
- Note: The search applies to all columns in the table, including numerical values, and does not accommodate boolean phrases (eg., AND, OR, NOT)

Table Widget with Active Search
| Anchor | ||||
|---|---|---|---|---|
|
Table widgets contain a contextual menu that you can access by clicking on any user, search phrase, destination or content title in the first column. Menus contain access to further information for relevant items. You can view more detailed data for a folder, single document or item including child items. You can also view more detailed data for specific users and user categories.
- To expand reports for an item, click the item and select the desired report template.
- The new report will open in a new window or tab depending on the user's browser preferences.
- To create a new drill down template, see "Report Templates."
Menus vary depending on the content type. Below are a series of table widgets with examples of contextual Drill Down menus. The following is an incomplete list of menu options, but includes descriptions of some helpful options:
- Open in New Window - Open the link in a new browser window.
- Copy to Clipboard - Copy the link for quick sharing.
- Clicked By - For External Destinations, Onsite Search Destination Pages, and other related widgets, this shows all users who have clicked on the listed link.
- Searched By - For Onsite Search Phrases and other related widgets, this displays all users who searched for a given phrase.
- Search Destination Pages - For Onsite Search Phrases and other related widgets, determine where visitors navigated on your site after searching for a given phrase.
- Site Visitors - For Page View Reports and Portal Growth Reports, find more complete information about who visited a listed page, or page and all of its child pages, depending on the current widget's settings.
- Visitor Activity - For Visitor Reports, display more information about all actions on your site by a listed user.

Onsite Search Destination Pages Table Widget Drill Down Menu

Previous Pages Table Widget Drill Down Menu

Unique Users Table Widget Drill Down Menu

Exit Pages Table Widget Drill Down Menu

Onsite Search Phrases Table Widget Drill Down Menu
| Anchor | ||||
|---|---|---|---|---|
|
Within advanced Table widget preferences, you have the ability to compare data from the current period of time with the previous equivalent period of time. For example if the current time range is "This Month" then the compare period will be "Last Month."
- To enable comparison of time periods, click on the table widget action menu and select Edit.
- Click on Advanced settings and enable the check box labeled "Compare to past period"
- Click Save to return to your report.

Page Views Advanced Table Widget Preferences - The table widget should now appear with the columns "Past" and "Change Rate"
- Past indicates the first column value for the previous period. In the example below, the number represents Past Views.
- Change Rate indicates the percent change between the last period and current period. The colored arrows indicate significant change; a red down arrow should appear when the change is more than -10%, a green up arrow for more than +10% and a yellow bracket for a stable change of -10% to 10%.

Page Views Table Widget with Compare to Past Period enabled
| Anchor | ||||
|---|---|---|---|---|
|
In the Meter Preferences tab you can set the basic parameters of your meter. The available options are:
- Min Value - This is the minimum value displayable on the meter, starting on the left.
- Max Value - This is the maximum value displayable on the meter, ending on the right.
- Undershoot - The meter will display the data in red for all values below this limit.
- Overshoot - The meter will display the data in red for all values exceeding this limit.
- Send Alert - A KPI Alert email will be automatically sent to the distribution list if the Undershoot or Overshoot values are reached.
After setting the widget's preferences, click Preview to view your changes in the preferences dialog, or click Save to save your choices and return to the report.

In the Advanced section you have the option to display data for either the selected website item and all of it's sub-pages, referred to as All Pages, or just the selected website item.
To view data for All Pages, select Yes from the drop down menu in the advanced settings. Select No to view data only for the selected website item

Meter Widget Advanced Preferences
| Anchor | ||||
|---|---|---|---|---|
|
The Question Mark ![]() icon in the top right cordner of all widgets is Help. The bubble displays the widget's status, preferences, and a brief description of the widget's features. Simply hover over the button to view the details.
icon in the top right cordner of all widgets is Help. The bubble displays the widget's status, preferences, and a brief description of the widget's features. Simply hover over the button to view the details.

Widget Help Bubble
Similarly, the widget description can be found in the settings dialog in the About This Chart section.

Widget "About This" Preference Dialog
| Anchor | ||||
|---|---|---|---|---|
|
Preference Filters for All Widgets in a Report
Use the top
Preferences panetoolbar to apply
similarfilters or a global time range for all widgets in a report. When using
this panepage filters, all individual display preferences for the widgets in the report are
over-written.If the widgets in the report use different filter settings, an alert will be displayed in the Preferences paneassigned the new value.
Note: Due to the fact that the widgets use different filter sets
(for instance,. For example, while some widgets filter Website
ItemItems by URL,
whileothers filter Website
Item by items inItems using the Object Explorer
), the filter settings in the Preferences pane will
be appliedapply only
for widgets containing the selected filters.The Preference pane - to apply and save - click GoThe Preferences pane (example: widgets with different Website Item filter)
to relevant widgets.

| Anchor | ||||
|---|---|---|---|---|
|
For enhanced performance and quick loading, widgets
display cached
modevalues while being edited in an existing report. Widgets in cached mode display
old data and are presented with a white filter layerstatic data based on the current date range selected in in the date range menu. To view current data for a
widget, click Refresh. To refresh data for all widgets in an editedreport, click
the Refresh button in the Top Toolbar.
Widgets in cached mode
The period expected when selecting each one of the date range options is as follows:
the Actions menu in the top left corner of the Reports main window and select Refresh.
A refreshed widget will display data according to the list below, depending on the time frame selected in the top right corner of the page.
- This Hour - shows cached data until the last rounded minute.
- This Day - shows cached data until the last rounded hour.
- Last X days - shows cached data until the last rounded hour.
- This Week - shows cached data until last rounded hour.
- This Month - shows cached data until last rounded day.
- This Quarter - shows cached data until last rounded day.
- This Year - shows cached data until last rounded day
Report drilldown is available from the site collection level to a single document, and for specific users and user categories.
To view reports for an item, click the item and select the desired report template.
The drilldown menu
To create a new template for drilldown, see "How to create a Template".
Report data caching is enabled by default. The cached data is stored in the database for 182 days. For more information see Reporting Data.

Report Center Actions Menu