Page History
Contents
| Table of Contents |
|---|
| Anchor | ||||
|---|---|---|---|---|
|
The CardioLog Diagnostics Service checks the status of the CardioLog Scheduling Service components and tracking agents and can also send service errors alerts via email.
...
- Schedule the CardioLog Diagnostics Service after the CardioLog Scheduling Service components have completed running. By default, the CardioLog Diagnostics Service runs every day at 8:30 AM.
- In the Administration pane, click System Diagnostics.
- In the Diagnostics Dashboard, click CardioLog Diagnostics Service.
- The CardioLog Diagnostics Service dialog allows you the choose the Service Schedule Type that works for you by defining the frequency that the system will run. The options are: The Service Schedule dialog includes the following fields:
Service Schedule - defines the schedule for running the service:
- Never - The service will not run unless manually activated, or until the Service Schedule Type is changedOnce - until a different scheduling option is chosen.
- Once - The service will run once, as soon as it is restarted.upon restarting the service
- Every rounded hour - The service runs every hour, on the hour. (Previously named "Hourly" and "Every full hour")
- Every X x minutes - The service will run at an interval of your choice.Every "Day" runs every x minutes beginning from when the service is restarted.
- Every *Day at HH:MM - You can choose to have Using the drop-down menus, choose either Day to run the service daily at a specific time, or weekly on a specific day and time.the day of the week if you would like to have the service run weekly. Choose the time of day the service will run in half hour intervals.
Enable Logging - The service activity is logged. The default log file path is at <CardioLog Installation Directory>\CardiologScheduleServices\Logs.
The log file size is limited to 8MB.
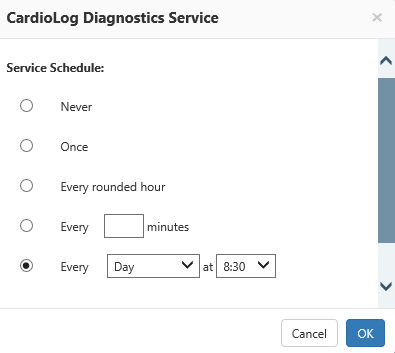
CardioLog Diagnostics Service dialog
| Anchor | ||||
|---|---|---|---|---|
|
...
Runtime
You can calculate the amount of time needed for each service component to run via the service component status window in the Diagnostics Dashboard:
- In the Administration pane, expand System Diagnostics.
- Click on Diagnostics Dashboard and select the service component.
- The start time is the Runtime Schedule, and the end time is the Last Runtime.
For example, If the Portal Tree Updates
...
starts every day at midnight (12:00 A.M) and finishes at
...
2:00 A.M, the total runtime is
...
2 hours.
For better resource utilization,calculate the amount of time needed for each service component to run, and schedule them to run in separate times. 
Portal Tree Updates Status dialog
| Anchor | ||||
|---|---|---|---|---|
|
...
- In the Administration pane, click System Diagnostics.

Diagnostics Dashboard dialog
- In the Services table, click CardioLog Diagnostics Service in order to edit the service schedule type.
CardioLog Diagnostics Service dialog
- In the Services table, click CardioLog Scheduling Service in order to view the status of the service.
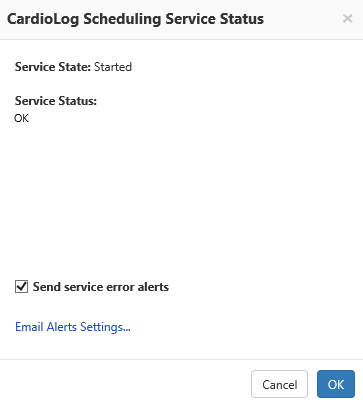
CardioLog Scheduling Service Status dialog - In the CardioLog Scheduling Service Status dialog, check the Send service error alerts checkbox in order to receive service error alerts via email.
Click Email Alerts Settings to configure the email settings.Anchor email alerts email alerts In the - In the Configure Email Settings dialog, fill out the following fields:
- Click Add to add the email address to the selected recipients list. Click Save, and restart CardioLog Scheduling Service.
- Services table, click each service component to view its status.
 Usage Data Processing
 - CardioLog Scheduling Service Component Status dialog
- In the Service Component dialog, click View log file to view the service component log file.
- In the Services table, click XML to view the status of all service components in a single XML web page. This web page can be used by other monitoring systems in your organization as well.
- SMTP Mail Server - A full DNS name for the SMTP Server. Example: "mycompany.com"
- SMTP User Name, SMTP Password - these are optional fields used for supplying credentials.
- System Administrator e-mail address - recipients list for service error alerts. Click the right arrow to select Email addresses.
To configure a secure SMTP server with a non-default port or the CardioLog reports email sender and subject, edit the following keys in the [CardioLog Installation Folder]\CardioLogSchedulingService\Settings.config file in the <handlersParams> section:
<param>
<handlerId>6</handlerId>
<name>SMTPMailFrom</name>
<val><![CDATA[CardioLog_Reports@intlock.com]]></val>
</param>
<param>
<handlerId>6</handlerId>
<name>SMTPUseSSL</name>
<val><![CDATA[0]]></val>
</param>
<param>
<handlerId>6</handlerId>
<name>SMTPPort</name>
<val><![CDATA[25]]></val>
</param>
<param>
<handlerId>6</handlerId>
<name>SMTPMailSubject</name>
<val><![CDATA[CardioLog Report]]></val>
</param><handler>
<handlerId>6</handlerId>
<handlerName>CardioLogScheduler</handlerName>
...
Configure Email Settings dialog
Select Users and Groups E-mail Address dialog
| Anchor | ||||
|---|---|---|---|---|
|
- In the Administration pane, click System Diagnostics.
- In the Tracking Agents table, click All Monitored Sites

All Monitored Sites Status dialog - In the All Monitored Sites Status dialog, you can define the Default Event Count Threshold and the Event Count Period (in hours).. The default threshold is 1000 events.
- In the All Monitored Sites Status dialog, select the Send service error alerts in order to receive service error alerts via email. These alerts are sent when the event count for all monitored sites is under the threshold in the last 24 hours.
- In the All Monitored Sites Status dialog, select the Send alerts on weekends in order to receive service error alerts via email on weekends.
- Click Email Alerts Settings to configure the email settings.
- In the Tracking Agents table, click Add.
To define a threshold for a specific monitored website, click Add in the Tracking Agents table.
Add Monitored Site dialog
- In the Add Monitored Site dialog, click Browse (...) in order to choose a site website from the Object Explorer dialog. Enter the default event count threshold for this site in the Threshold field.

Choose a site website from the Object Explorer dialog
- In the Tracking Agents table, click on each Monitored Site in order to edit or delete it.

Edit Monitored Site dialog