Page History
Use the Report Center to gain a fresh insight into your website with a wide range of usage reports and dashboards. In the Report Center, you can easily create dynamic reports that feature charts and tables, either by making use of one of CardioLog's existing templates, or by building a report from scratch. You can schedule reports to run automatically at any interval you like, and you can set permissions for who can view and edit each report to ensure that the right people have access to the right data. It's also possible to export a report in several standard formats including SharePoint web parts and CSV, and to email reports to distribution lists or individual colleagues.
Contents
| Table of Contents |
|---|
- How to Create a Report
- How to Edit a Report
- How to Copy a Report
- How to Create a Report based on a Template
- How to Set Permissions for a Report
- How to Export a Report to Excel
- How to Export a Report to PDF
- How to Export a Report as a Microsoft SharePoint Web Part
- How to Send a Report via Email
- How to Set an Email Distribution List for a Scheduled Report
- How to View a Report from SharePoint's Site Actions Menu
...
- When the report is in View Mode, click Export to PDF from the Share menu
Share menu in View mode - The report will be downloaded to your default downloads location.
Anchor send email send email
How to Send a Report via Email
| send email | |
| send email |
- When the report is in View Mode, click Send To from the Share menu.
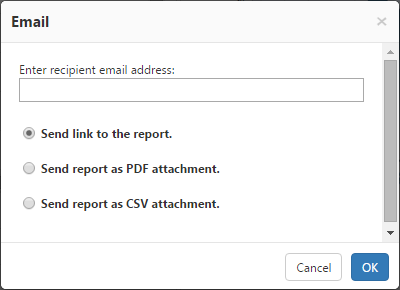
- In the new email window, enter an email address
- Choose how you would like your recipient to view the report and click OK.
Send Email window
| Anchor | ||||
|---|---|---|---|---|
|
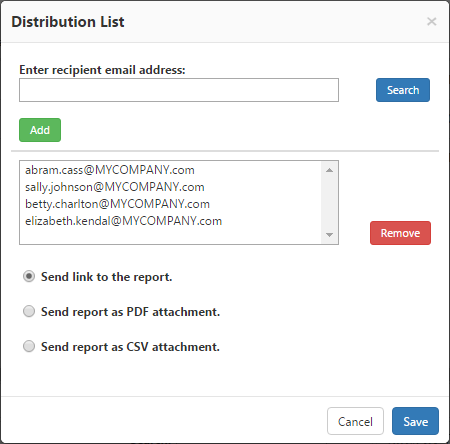
Once a new non ad-hoc report is created, an automated email can be sent to a predefined distribution list. This email includes a unique link, a PDF file or CSV file attachment with the most recent report data. The email may be sent to the distribution list monthly, weekly or daily, according to the report's scheduling preference.
- Open a report in View Mode and select Distribution List from the SHARE menu.
- Enter an email address in the text box and click the Add button to add the address to the distribution list.
- Add any additional email addresses you would like to include.
- Click Save.
Distribution List Dialogue
| Anchor | ||||
|---|---|---|---|---|
|
- Confirm the report is in View Mode.
- Click Generate Report from the Actions menu if at least one Static Report does not exist yet. Click Create Web Part from the Share menu.
- The report will be downloaded as a DWP file to your browser's default downloads location.
- You can now add the dynamic Dashboard Web Part to your SharePoint web site.
| Anchor | ||||
|---|---|---|---|---|
|
- The CardioLog system administrator must first create and publish report templates. These templates will then be available from all SharePoint portal pages.
- Once logged into the SharePoint portal, click the Site Actions settings gear to access the page options, By default, the logged in user requires SharePoint view permissions to see the report.
- Click Site Statistics to generate a usage report for your page. The report will open in a new browser tab or window depending on your local preferences.
- Select the desired report template and date range in order to run a relevant usage report for the page you are visiting.
CardioLog Site Statistics SharePoint Menu Item


