Page History
...
- To add a new widget, click any blank area of the report where a plus sign appears as you hover your cursor over the central area, or click Add at the top of the Central Area Toolbar and select a widget to add to the reportcategory.
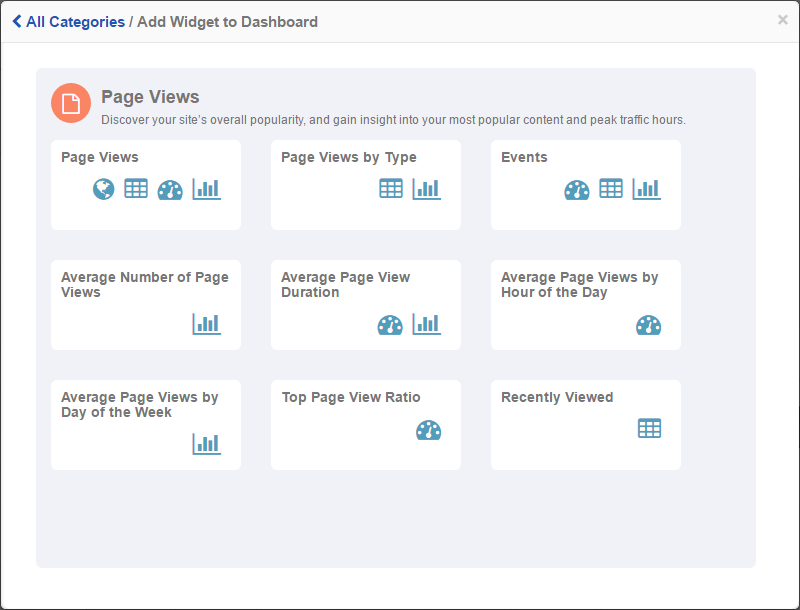
Add Widget Dialogue - Click the category type you'd like and you'll be presented with a list of all available widgets in the category. Click on the icon of the available widget type you'd like: map, chart, meter or table. The new widget will now appear in your report. To add more widgets, repeat these two steps.
Page Views Widget Category - Once a widget is available in your report, you can edit all filters and time ranges for each widget separetely from the whole report as long as the report is in Edit mode.
- Click on the title of a widget to move the whole widget to any part of the report's display, and to rearrange the presentation of the report.
- You can click on the right-side or bottom border of any chart, table or map widget to resize it to a comfortable view. This is especially helpful for charts and tables depending on the type and amount of information presented.
- In addition to full report export options described further below, you can also export individual widget data to a CSV file. Simply click on the setting gear in the upper right corner of any widget and select Export to CSV. A CSV will be downloaded to your browser's default download location.
...
